The Results
Our aim here at BACC is to make life better when it comes to getting around Bridgwater — not just for bikes, but for everyone. Of course, we do know a thing or two about cycling, but we wanted to know how you, the general public, think things could be improved. Thank you so much for taking part!
What were your opinions on the current state of affairs? What would encourage people to cycle more? And what are the obstacles holding you back?
Here’s some of the most interesting stuff we found…
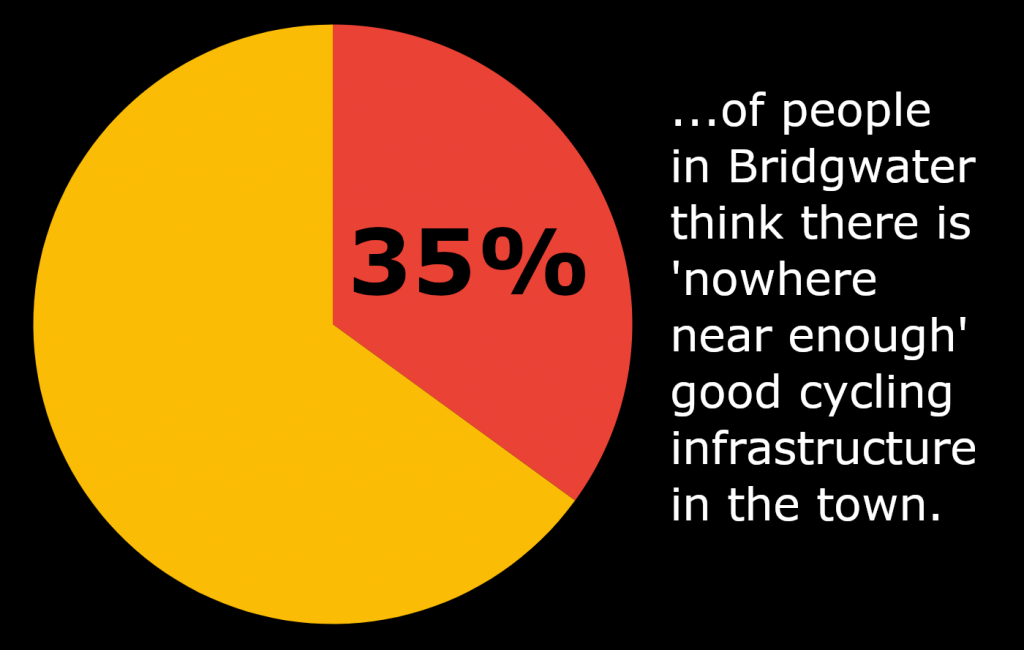
We asked, “Do you think there is enough good cycle infrastructure in and around Bridgwater?” On a scale of 1 to 5 (1 being the worst), 35% of people said ‘nowhere near enough’, while a further 26% rated it 2, and 26% gave it a 3.
Getting to school
When asked “How well does existing infrastructure encourage cycling to school?” (again rated from 1 to 5), 36% said ‘very poorly’ (i.e. 1).
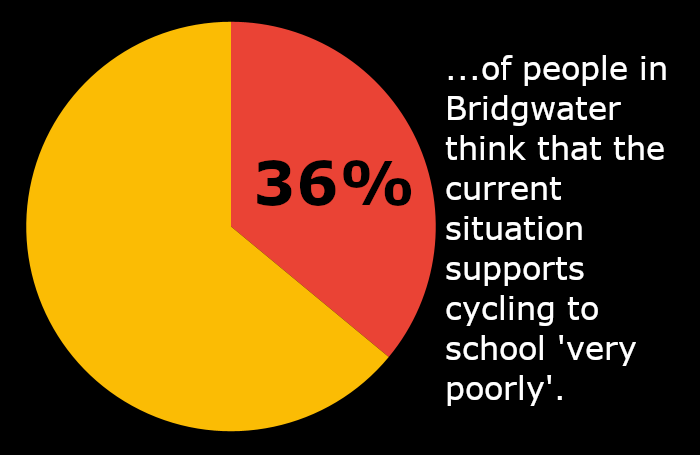
33% of respondents gave it a 2, and 23% rated it a 3.
By the way, if you think things should be better for kids getting about by bike, you might want to join us for a Kidical Mass ride. We’ve already done two, and hope to do more in 2024!
What would help?
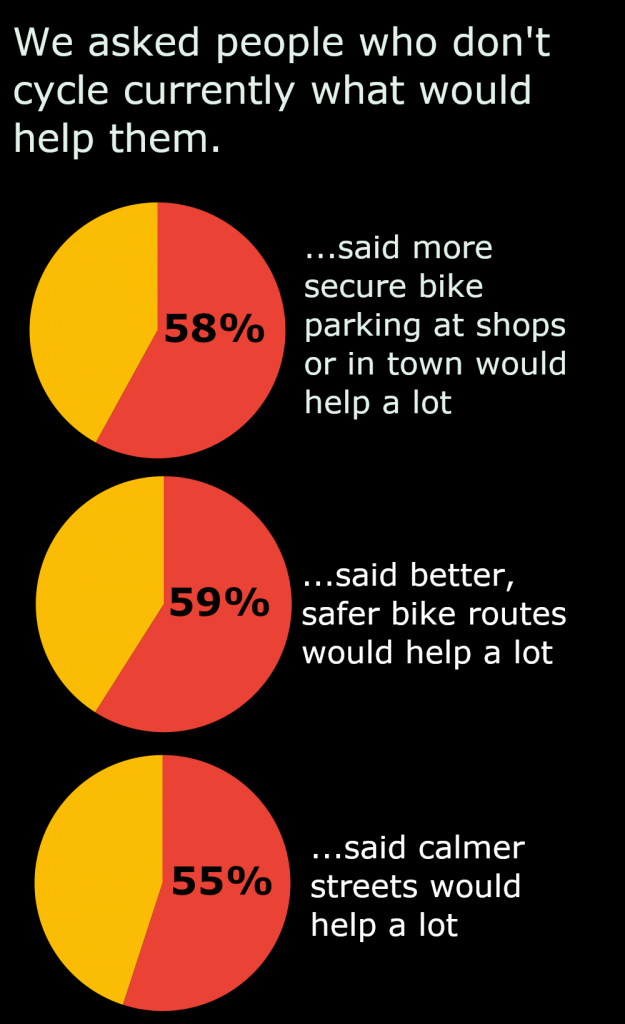
We asked people to rate certain things on how much they would help them to cycle more — either ‘a lot’, ‘somewhat’ or ‘not at all’. Then we looked at the responses from those who don’t cycle currently i.e. the bike isn’t their main means of transport for short trips). Here’s what we found:
As you’ll know, we already campaign actively for improvements to our infrastructure so that people can walk and cycle safely.
In future, we’ll also be looking at ways in which motor traffic could be reduced or made calmer, and asking for better provision of cycle parking around town.
Where do you feel most vulnerable when sharing the road? Bristol Road? Taunton Road?
And where would you most like to lock up your bike safely but can’t? Let us know!
What puts you off?
As well as putting things in place to make it easier to get on your bike, there are some obstacles that need to be overcome, too.
Among those people who don’t cycle currently, some factors put them off ‘a lot’, ‘somewhat’ or ‘not at all’.
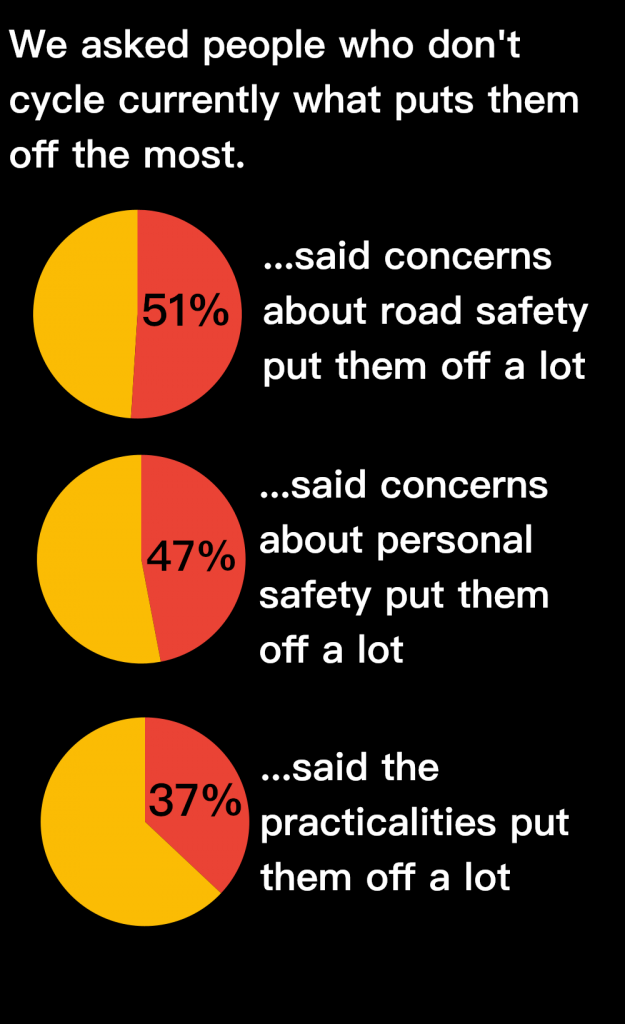
What’s interesting about the last figure above — although perhaps unsurprising — is that it goes up to 47% for women. This might be a reflection of the fact that it’s often women who are making short trips around town for things like the school run or shopping errands.
So in future, BACC will be prioritising ways in which we can open up the town for women to get on their bikes more often.
While these figures are quite revealing, it’s also interesting that the vast majority of people aren’t bothered about how they look; 93% said they weren’t at all concerned about appearing unprofessional or unable to afford a car. Meanwhile, 78% said their own fitness wasn’t a concern at all.
However, this last figure drops to 57% in those who earn under £40k, which may suggest that those on lower incomes have less time for keeping fit and active.
Again, this is something that BACC can focus on going forward. If you’re one of those who doesn’t currently feel fit enough to ride around town, maybe we can help. Take a look at our rides page, which is often updated with new dates and a variety of rides. And if you don’t see anything there currently, drop us a quick message saying what you’d like — chances are, there will be other people in the same boat! And we are always happy to accommodate everyone.
Overall, then, we have some clear targets for our work in 2024. Some of these are familiar, some less so. But in any case, these statistics give BACC and our political leaders a clear mandate to make things better.
What do you think? As ever, we want to hear from you, so get in touch to tell us your views!