We all know by now that active travel has to play a key part in tackling the climate crisis.
The government has set out clear plans on the ways it wants to make walking, wheeling and cycling more attractive. This process started back in 2015 with the Infrastructure Act, which was followed up with the first Cycling & Walking Investment Strategy (CWIS1) in 2017. This set targets, including doubling the number of cycling journeys (from 2013 to 2025), increasing walking activity in general, and increasing the percentage of children walking to school. Then Gear Change was published in 2020. In it, the government said it wants to see “half of all journeys in towns and cities being cycled or walked by 2030.” So, how’s it going?
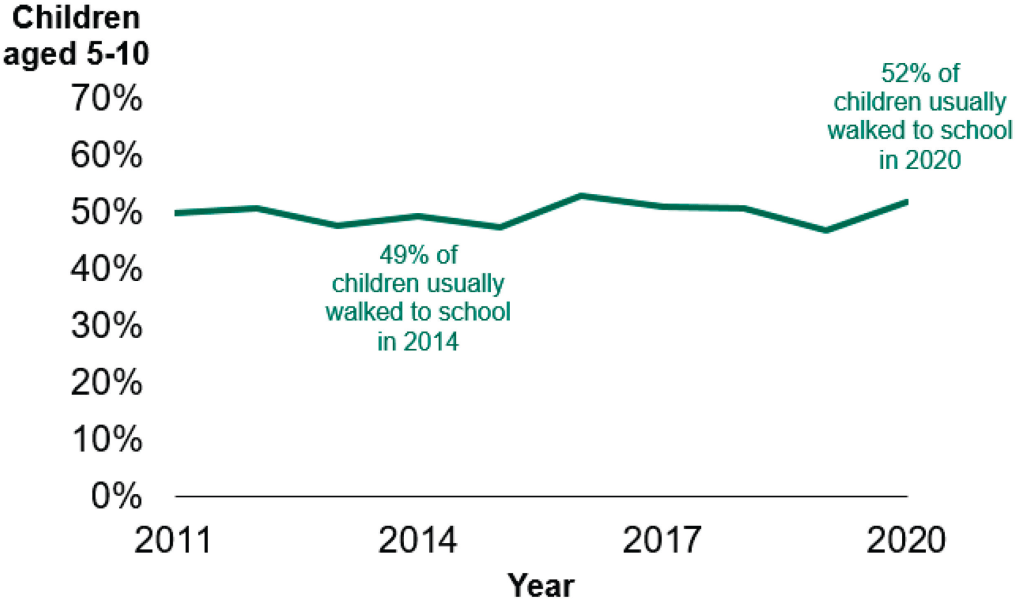
To answer that, the Cycling & Walking Investment Strategy 2022 (CWIS2) has just been published. In terms of general walking activity, the government admits that the figures have been heavily impacted by the pandemic. Before that, though, things were on track.

The picture for walking to school is slightly better:

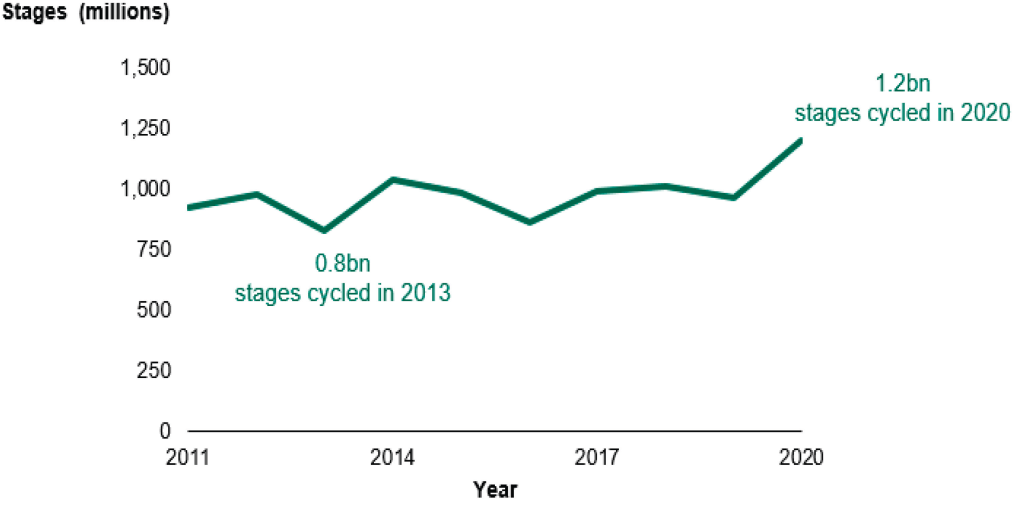
But what about cycling? The first CWIS set the aim of “[doubling] cycling, where cycling activity is measured as the estimated total number of cycle stages made each year, from 0.8 billion stages in 2013 to 1.6 billion stages in 2025.” CWIS2 goes on to say: “In 2020, people cycled an estimated total of 1.2 billion stages – an increase of around 0.4 billion stages, or 45%, since 2013 (CWIS1 baseline). Since 2014, total cycling stages have consistently been higher than 2013 levels, but trends have fluctuated each year. Further increases of 0.4bn cycling stages per year are required to achieve the aim of 1.6 billion stages by 2025.”

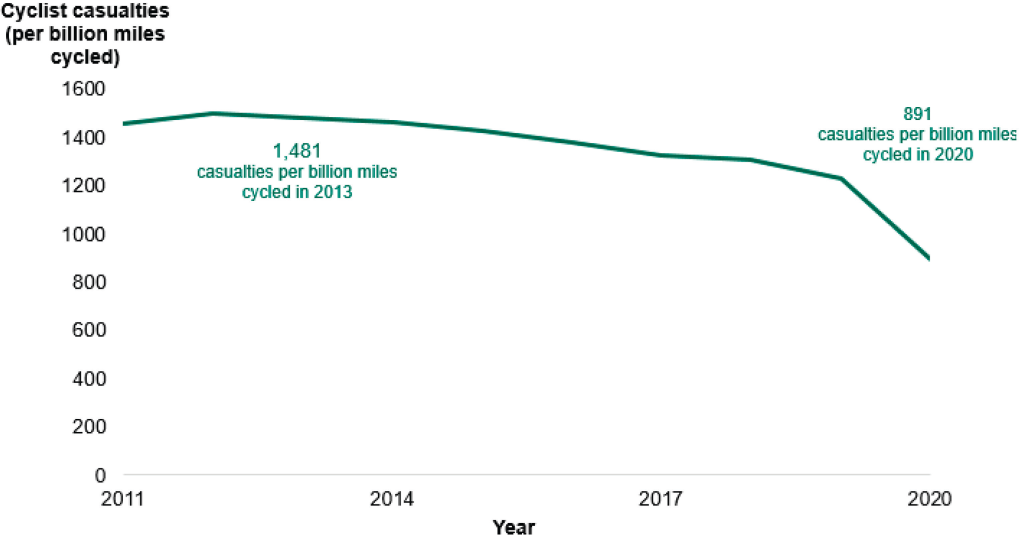
Another key objective of CWIS1 was to cut the number of cyclists killed or seriously injured. Obviously, we all want to see these incidents eliminated, but so far, it looks like things are going in the right direction…

Investment
So how are they proposing to achieve this? Where is the money being spent? Here are a few of the strategies, together with some figures on how they’re going:
Bikeability
This is cycle training for school children in order to give the next generation of cyclists the skills and confidence to cycle safely on local roads.
• 355,756 training places were delivered between April 2016 and March 2017.
• 404,791 training places were delivered between April 2017 and March 2018.
• 411,000 training places were delivered between April 2018 and March 2019.
• 420,407 training places were delivered between April 2019 and March 2020.
• 140,390 training places were delivered between April 2020 and March 2021.
Cycle to Work Scheme
This provides a tax-efficient, salary-sacrifice employee benefit, introduced in the 1999 Finance Act, which provides a way of encouraging more adults to take up cycling.
“The Cycle to Work Scheme saw increased participation during the pandemic due to people preferring to avoid public transport, stay safe and increase fitness on their commute. According to data from the stakeholder group, Cycle to Work Alliance, between March and September 2020, Alliance members saw an increase of nearly 60% in new scheme joiners compared to the same period in 2019 across the UK.”
Big Bike Revival
“The Big Bike Revival social marketing campaign … aims to get people who own a cycle, but do not currently use it, back in the saddle through engaging a network of established community-focused initiatives. The campaign helps to make cycling accessible to those that stand to benefit the most, typically hard to reach communities within some of the more deprived regions of society.”
“£1 million was invested in the Big Bike Revival between April 2019 and March 2020, which reached over 58,000 people (45% were from the most deprived deciles in England), delivered across 1,341 events in 150 locations.
“A further £2 million of funding was provided for the programme in 2020/21, which has enabled over 2,500 Dr Bike events to be delivered, with 13,000 cycles fixed.
“Due to the pandemic restrictions, the majority of community events could not take place, with some workstreams extended to be delivered into 2021 to 2022. Early delivery in 2020 shifted focus to support key workers to cycle for essential journeys, later moving to supporting widespread delivery of Dr Bike events nationwide.”
What about Bridgwater?
For all the hot air of politics, it’s good to see the government holding itself to account, especially when it comes to something as serious as the climate emergency – and, of course, cycling!
But this is just the national picture. What about Bridgwater and the surrounding area? We have our own ideas about where investment could and should be made around here. But what do you think? Where would you invest if you were in charge? What are the problem areas in Bridgwater? We’d love to hear from you, so get in touch on our contact page, via Facebook, Twitter or Instagram.
